Introduction
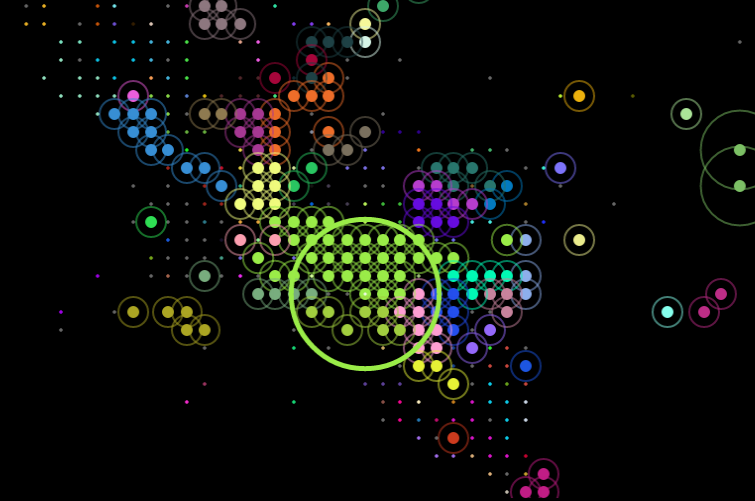
Flux is an interactive visualization that shows transaction flows between different cells (tiles) and zip codes while combining information from Foursquare areas in the given Mexican cities
The display allows to determine which are the areas that exercise as a pole of attraction for trade and which are the areas which are a source ofcommercial flow
Description
The visualization shows a map of cells (each 550x450m) in this three cities during the sample (November 2013 - April 2014)
The API provided by BBVA shows all transactions with credit card in each of the cells, aggregated by postal code
This information is combined with information Geographical provided by the google maps API (geolocation cells), and the venues information provided by the Foursquare API.
Both data sources have been categorized by types of activity
How it works
Once you select a city, click on a tile to select it, then the visualization will show transactions (incomes and outcomes) performed in each cell, numerically and with a representation Circular proportional to the total quantity, this information is combined with the Foursquare venues data in the tile
Data sources
The project uses three sources of information:
- The BBVA API. Were obtained the transactions in each tile divided by zip code and grouped by month, Innova Challenge MX API
- Googlemaps API to determine the code zip and city of each cell and display the map, https://developers.google.com/maps/
- The "venues" foursquare API to show the busiest centers in each of the cells, https://developer.foursquare.com/overview/venues.html
Frameworks and libraries used
- HTML5, canvas, custom javascript code
- Jquery, AngularJS, Velocity js libraries
- Code Igniter, MVC framework
About Pimpampum
Pimpampum is a company focused on the design and development of interactive applications
In our lab we are dedicated to experiment with interactive visualization and proposals
http://www.pimpampum.net/en/projects_lab
More information in pimpampum.net
Enter: